Paradoxes, fake news and dumb AI

In 1973, the University of California, Berkeley admitted 44% of male applicants and 35% of female applicants.
Yet, it did not discriminate against women.
Paradoxes like this one are commonplace and:
- cause data scientists to inadvertently introduce bias in their machine learning models.
- support the spread of fake news.
- make it hard to be a good data scientist.
In this article we will investigate the above statement to understand how:
- statistics, fake news spreaders and AI trick you.
- you can become a living lie detector.
The statistics behind the story
When researchers dug into UC Berkeley’s 1973 admissions data, they actually realised that the largest departments show more often than not, a bias in favour of women. This meant that UC Berkeley had not clearly discriminated applicants based on their gender.
How is that possible?
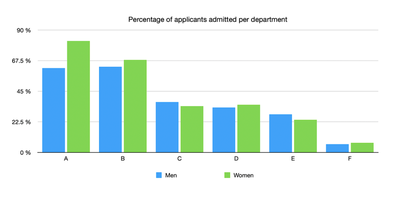
The key resides in how applications are distributed across department. It clearly appears on the plot below that women applied to more competitive departments than men. In particular, very few women applied to departments A and B, which are by far the easiest to get into.
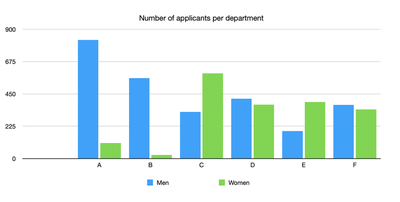
Now, whether there is a bias in our society that encouraged women not to apply to these departments, that’s a different story which I will not cover in this article.
Simpson’s paradox
The presence of a hidden variable of importance (in the case of UC Berkeley admission it’s the department) which reverses a trend is called Simpson’s paradox.
The visualisation below shows how it can have a dramatic effect on a regression when the hidden variable is not considered.
How to arm your common sense against such paradoxes
In order to avoid believing fake news or implementing incorrect models, let’s follow a plan:
- List all the variables that may play a role in the interpretation of the data.
- Create a causality DAG of all variables and ensure you are not omitting latent or colliding variables in your analysis.
- Check from the DAG if an alternate conclusion exists which is also plausible.
- If the data is available, check the which conclusion is most likely correct.
Food for thought
Here are some other interesting examples of paradoxes encountered in data science:
Underweight newborns with a smoking mother have a lower mortality rates than underweight newborns of non-smoking mothers. Does that mean that maternal smoking has a positive impact on the baby’s health?
In the event of a fire, the more firefighters are deployed, the more people are injured. Does that mean that deploying more firefighters injures people?
The key to all these problems resides in causality, which is way too often overlooked in the AI field.
Sixte de Maupeou
Freelance data scientist
I have a passion data science and AI, especially machine learning and I aim to contribute to improving education in this domain.